Difference between revisions of "RootsMagic 8:Charts (Reports)"
| (12 intermediate revisions by the same user not shown) | |||
| Line 7: | Line 7: | ||
To print a Box Chart: | To print a Box Chart: | ||
| − | # | + | #Select the Publish page |
| − | # | + | #Select "All reports and charts" |
| − | + | #Select "Box Chart" | |
| − | # | + | #Select your options from the Reports Settings panel: |
| − | #Select your options from the Reports Settings | ||
#;[[File:RM8_Publish-Reports-BoxChart-1.jpg|Box Chart Settings]] | #;[[File:RM8_Publish-Reports-BoxChart-1.jpg|Box Chart Settings]] | ||
##Start person – Select the person who the report will begin with. Use the "Start person" button to choose the person from the "RootsMagic Explorer" screen. | ##Start person – Select the person who the report will begin with. Use the "Start person" button to choose the person from the "RootsMagic Explorer" screen. | ||
| Line 36: | Line 35: | ||
To print a pedigree chart: | To print a pedigree chart: | ||
| − | # | + | #Select the Publish page |
| − | # | + | #Select "All reports and charts" |
| − | #Select your options from the Report Settings | + | #Select "Pedigree Chart" |
| + | #Select your options from the Report Settings panel: | ||
#;[[File:RM8_Publish-Reports-PedigreeChart-Settings.jpg|Pedigree Chart Settings]] | #;[[File:RM8_Publish-Reports-PedigreeChart-Settings.jpg|Pedigree Chart Settings]] | ||
##Starting person – Select the starting person for your pedigree chart (this person will be the person at the far left of the first chart). By default RootsMagic will use whoever was highlighted on the main screen when you opened the Reports dialog, but you can change the person here. | ##Starting person – Select the starting person for your pedigree chart (this person will be the person at the far left of the first chart). By default RootsMagic will use whoever was highlighted on the main screen when you opened the Reports dialog, but you can change the person here. | ||
| Line 50: | Line 50: | ||
##Include private facts – Mark this checkbox to print any facts you have marked as private. | ##Include private facts – Mark this checkbox to print any facts you have marked as private. | ||
##Print preparer – Mark this checkbox to have RootsMagic print the preparer info on the charts. | ##Print preparer – Mark this checkbox to have RootsMagic print the preparer info on the charts. | ||
| − | + | #Choose Layout, Styles and Indexes from the <u>[[RM8:Report_Settings|report settings]]</u>. | |
| − | #Choose | + | #Click the "Generate Report" button to generate the report and display it in the Report Viewer. From there you can modify the report settings, send the report to your printer, or save the report to disk. |
| − | #Click the "Generate Report" button to generate the report and display it in the Report Viewer. From there you can modify the report settings, send the report to your printer, save the report to disk | ||
== Photo tree == | == Photo tree == | ||
| Line 58: | Line 57: | ||
To print a Photo Tree chart: | To print a Photo Tree chart: | ||
| − | # | + | #Select the Publish page |
| − | # | + | #Select "All reports and charts" |
| − | + | #Select "Photo Tree" | |
| − | # | + | #Select your options from the Reports Settings panel: |
| − | #Select your options from the Reports Settings | ||
#;[[File:RM8_Publish-Reports-PhotoTree-Settings.jpg|Photo Tree Settings]] | #;[[File:RM8_Publish-Reports-PhotoTree-Settings.jpg|Photo Tree Settings]] | ||
##Starting person – Select the "root" person that will appear at the bottom of the tree. | ##Starting person – Select the "root" person that will appear at the bottom of the tree. | ||
##Title – Enter the title to be printed in the header. | ##Title – Enter the title to be printed in the header. | ||
##Include siblings of start person – Mark this checkbox if you want to include the brothers and sisters of the start person in the tree. | ##Include siblings of start person – Mark this checkbox if you want to include the brothers and sisters of the start person in the tree. | ||
| − | # | + | #Choose Layout and Styles settings from the <u>[[RM8:Report_Settings|report settings]]</u>. |
| − | + | #Click the "Generate Report" button to generate the report and display it in the Report Viewer. From there you can modify the report settings, send the report to your printer, or save the report to disk. | |
| − | #Click the "Generate Report" button to generate the report and display it in the Report Viewer. From there you can modify the report settings, send the report to your printer, save the report to disk | ||
== Relationship chart == | == Relationship chart == | ||
| Line 76: | Line 73: | ||
To print a Relationship Chart: | To print a Relationship Chart: | ||
| − | + | #Select the Publish page | |
| − | + | #Select "All reports and charts" | |
| − | + | #Select "Relationship Chart" | |
| − | + | #Select your options from the Reports Settings panel: | |
| − | + | #;[[File:RM8_Publish-Reports-RelationshipChart-Settings.jpg|Relationship Chart Settings]] | |
| − | + | ##Select the two people – Click on either of the two buttons to select the two people you want to create the relationship chart for. The first button will default to the person who was highlighted when you opened the report dialog. When you click a button, RootsMagic will display a list of people for you to select the individual from. | |
| − | + | ##Title – Enter the title to display in the header. | |
| − | + | ##Include what information for each person – Select the type of information you want printed in the box for each generation. You can include: | |
| − | + | ###Birth and death years | |
| − | + | ###Marriage date | |
| − | + | ###Print private facts - Mark whether you want to include facts that are marked private or not. | |
| − | + | #Choose Layout and Styles settings from the <u>[[RM8:Report_Settings|report settings]]</u>. | |
| − | + | #Click the "Generate Report" button to generate the report and display it in the Report Viewer. From there you can modify the report settings, send the report to your printer, or save the report to disk. | |
| − | |||
| − | |||
| − | |||
| − | |||
| − | |||
| − | |||
| − | |||
| − | |||
| − | |||
| − | |||
| − | |||
| − | |||
| − | |||
| − | |||
| − | |||
| − | Select your options from the Reports Settings | ||
| − | |||
| − | [[File:RM8_Publish-Reports-RelationshipChart-Settings.jpg|Relationship Chart Settings]] | ||
| − | |||
| − | |||
| − | |||
| − | |||
| − | Select the two people – Click on either of the two buttons to select the two people you want to create the relationship chart for. The first button will default to the person who was highlighted when you opened the report dialog. When you click a button, RootsMagic will display a list of people for you to select the individual from. | ||
| − | |||
| − | |||
| − | |||
| − | |||
| − | |||
| − | |||
| − | Title – Enter the title to display in the header. | ||
| − | |||
| − | |||
| − | |||
| − | |||
| − | |||
| − | |||
| − | Include what information for each person – Select the type of information you want printed in the box for each generation. You can include: | ||
| − | |||
| − | |||
| − | |||
| − | |||
| − | |||
| − | |||
| − | Birth and death years | ||
| − | |||
| − | |||
| − | |||
| − | |||
| − | |||
| − | |||
| − | Marriage date | ||
| − | |||
| − | |||
| − | |||
| − | |||
| − | |||
| − | |||
| − | Print private facts - Mark whether you want to include facts that are marked private or not. | ||
| − | |||
| − | |||
| − | |||
| − | |||
| − | |||
| − | |||
| − | |||
| − | |||
| − | |||
| − | |||
| − | |||
| − | |||
| − | |||
| − | Choose | ||
| − | |||
| − | |||
| − | |||
| − | |||
| − | |||
| − | |||
| − | Click the "Generate Report" button to generate the report and display it in the Report Viewer. From there you can modify the report settings, send the report to your printer, save the report to disk | ||
Latest revision as of 00:20, 8 September 2021
Navigation: RootsMagic 8 > Reports And Charts >
Box chart
The Box Chart lets you print ancestor or descendant box charts which can be used in books because they print on standard sized pages.
To print a Box Chart:
- Select the Publish page
- Select "All reports and charts"
- Select "Box Chart"
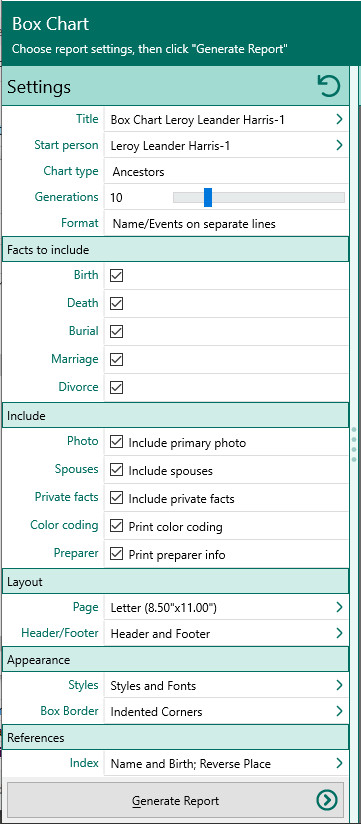
- Select your options from the Reports Settings panel:
- Start person – Select the person who the report will begin with. Use the "Start person" button to choose the person from the "RootsMagic Explorer" screen.
- Chart type – Choose the type of chart you want to create:
- Ancestors - Prints a box chart of the starting person and his/her ancestors. Only direct ancestors are included in the chart.
- Descendants - Prints a box chart of the starting person and his/her descendants. Each generation is indented a bit to the right, and connecting lines are drawn to show the links between generations.
- Generations – Select the number of generations you want to include in your box chart.
- Format – Lets you select how to print each person’s information in the chart. You can choose from:
- Names and events each on a separate line – RootsMagic will print the name of each person on a line, then print each fact type you choose to print on a separate line under the name.
- Single line with birth and death date (no boxes) – RootsMagic will print the name of each person followed by their birth and death date on the same line.
- Names and events word wrapped (more compact) – RootsMagic will print the name followed by the facts you choose word wrapped to fit inside the box.
- Facts to include - lets you choose which facts you want to include in each person’s box. You can choose from birth, death, burial, marriage, or divorce, or any combination of these facts.
- Include photos - specifies whether RootsMagic will include photos of individuals in the chart.
- Include spouses - lets you choose whether spouses should be included in the descendant box chart. This option is not applicable when printing an ancestor chart.
- Print private facts - Mark this checkbox to indicate you want to include facts that are marked private.
- Print color coding - Mark this checkbox if you want RootsMagic to only print details in color for those who have color coding applied.
- Preparer - Choose whether to print the preparer's name and address at the end of the report
- Choose the various layout and style settings for the report
- Click the "Generate Report" button to generate the report and display it in the Report Viewer. From there you can modify the report settings, send the report to your printer, or save the report to disk.
Pedigree chart
You can print a four, five, or six generation pedigree chart for anyone in your database.
To print a pedigree chart:
- Select the Publish page
- Select "All reports and charts"
- Select "Pedigree Chart"
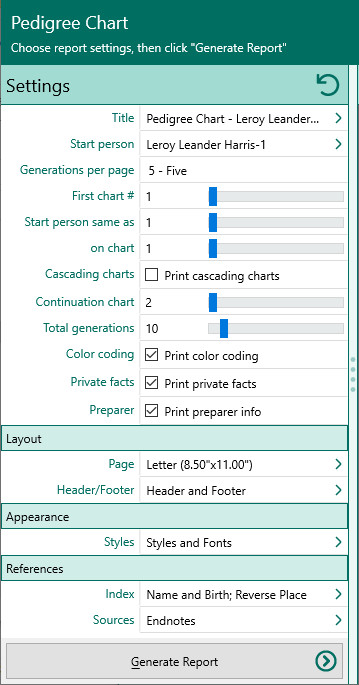
- Select your options from the Report Settings panel:
- Starting person – Select the starting person for your pedigree chart (this person will be the person at the far left of the first chart). By default RootsMagic will use whoever was highlighted on the main screen when you opened the Reports dialog, but you can change the person here.
- Generations per page – Select the number of generations you want to show on each page of your pedigree chart (4, 5, or 6).
- Chart number of 1st chart - Enter the number of the first chart printed (usually "1").
- Start person is same as X on chart Y - Tells you if the first person on one of the cascading chart pages appears on another chart. This information is at the top of the printout and gives you the chart number where the person is repeated and his or her number in that particular chart.
- Print cascading charts - Mark this checkbox if you want to produce a series of pedigree charts that span multiple generations for the highlighted person and then for each person in the last generation of the first chart. When you choose cascading charts, you have the following additional options.
- Starting number of continuation charts - Enter the number of the second chart printed.
- Number of generations to print - Enter the number of generations to print (up to 30).
- Color coding – Mark this checkbox to print any color coded people in color.
- Include private facts – Mark this checkbox to print any facts you have marked as private.
- Print preparer – Mark this checkbox to have RootsMagic print the preparer info on the charts.
- Choose Layout, Styles and Indexes from the report settings.
- Click the "Generate Report" button to generate the report and display it in the Report Viewer. From there you can modify the report settings, send the report to your printer, or save the report to disk.
Photo tree
The photo tree is a photo of a tree with a 3-generation ancestry overlaid on it. You can choose the box style you want and whether or not you want to include the siblings of the highlighted person. This report will support up to 20 children. The photographs will be positioned throughout a tree with the highlighted person on the trunk, with siblings (if you checked that box) on the trunk of the tree as well, and the rest of the family members - father, mother, and grandparents - will be positioned higher up the tree.
To print a Photo Tree chart:
- Select the Publish page
- Select "All reports and charts"
- Select "Photo Tree"
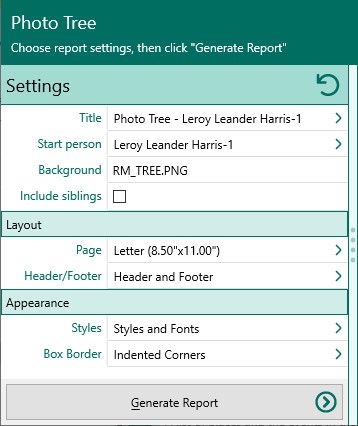
- Select your options from the Reports Settings panel:
- Starting person – Select the "root" person that will appear at the bottom of the tree.
- Title – Enter the title to be printed in the header.
- Include siblings of start person – Mark this checkbox if you want to include the brothers and sisters of the start person in the tree.
- Choose Layout and Styles settings from the report settings.
- Click the "Generate Report" button to generate the report and display it in the Report Viewer. From there you can modify the report settings, send the report to your printer, or save the report to disk.
Relationship chart
The Relationship Chart lets you show how any two people in your database are related. Simply select the two people, and RootsMagic will display a box chart showing how the two people descend from a common ancestor (or from each other).
To print a Relationship Chart:
- Select the Publish page
- Select "All reports and charts"
- Select "Relationship Chart"
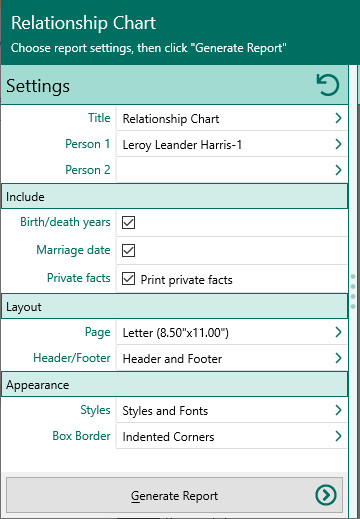
- Select your options from the Reports Settings panel:
- Select the two people – Click on either of the two buttons to select the two people you want to create the relationship chart for. The first button will default to the person who was highlighted when you opened the report dialog. When you click a button, RootsMagic will display a list of people for you to select the individual from.
- Title – Enter the title to display in the header.
- Include what information for each person – Select the type of information you want printed in the box for each generation. You can include:
- Birth and death years
- Marriage date
- Print private facts - Mark whether you want to include facts that are marked private or not.
- Choose Layout and Styles settings from the report settings.
- Click the "Generate Report" button to generate the report and display it in the Report Viewer. From there you can modify the report settings, send the report to your printer, or save the report to disk.


